Date
2012
Category
Systems Mapping, Information DesignFood Waste in North America
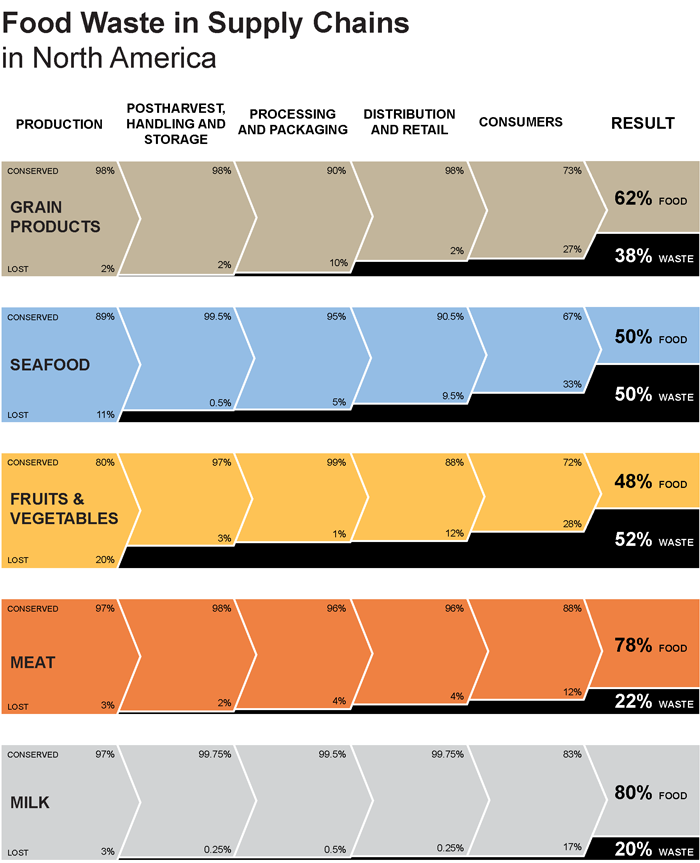
This chart shows where food waste is generated in five key supply chains in North America. The data is drawn from the excellent 2012 NRDC report, Wasted: How America is Losing up to 40 Percent of its Food from Farm to Fork to Landfill. The chart is proposed as an alternative to the graphics published in the original report, which did not provide an intuitive visual understanding of where waste occurs in each supply chain.
Download a PDF version here
Download the NRDC report here


